
Chrome’s console api: greatest hits
Update 4/3: Someone was nice enough to post this on Hacker News, so there’s some further discussion at https://news.ycombinator.com/item?id=9314185 for those interested.
The Chrome debugger is the best tool for locating problematic code in a JavaScript application, but there are times that diving into your code line-by-line isn’t the fastest or most convenient means to that end. We all know about console.log(), but I thought I’d write about a few of its lesser-known cousins that are more refined, and can be a lot more expressive.
As a bonus, check out the last section of this post for important info on Chrome’s confusing, non-intuitive behavior when you use the console to inspect an object or array.
Assert
console.assert() takes two arguments: a condition to be evaluated, and a string to display if that condition is false. If the condition is true, nothing is displayed.
The condition argument will generally be a variable you want to inspect at runtime, or a function which will be evaluated based on its return value. In either case, the final value is type-converted to boolean.
Logging assertions to the console is an easy way to test a small piece of code ‘on a budget,’ without the overhead of a test suite.
Here’s an example:
// Basic format of assertions
console.assert(true, 'This text will never be displayed');
console.assert(false, 'This will appear as an assertion failure in the console.');

// Asserting that the return value of a function is true
var a = 4;
var isGreaterThanFive = function(num) {
  return num > 5;
}

console.assert(isGreaterThanFive(a), 'This text will appear because a is less than 5');
The assertion also captures and displays the call stack at the time of any failure.
Count
console.count() is a method that logs the number of times it has been invoked as the program runs. It takes a message string as an argument; each time the .count() line is invoked, the message is displayed in the console, along with the running count.
for(var a = 3; a >=0; a--) {
    console.count('called');
}

// Console output:
// called: 1
// called: 2
// called: 3
// called: 4
The big issue with this one is that it prints to the console on every invocation. You’ll want to use it to count something occasional rather than, say, the number of times a recursive function is called.
Dir
By default, Chrome’s console.log() method hides a lot of useful information, especially within objects, arrays, functions and regular expressions. console.dir() lets you inspect those types with a lot more depth than .log(). Here’s a basic example to demonstrate:

Caveat warning:
console.dir() has some unexpected behavior that you should definitely be aware of. Make sure you read the ‘caveats’ section at the end of this post for details!
debug, log, info, warn, & error: what you might not know
The sister methods .debug(), .log, .info(), .warn() and .error() all do basically the same thing. Each represents a severity level for a message (ascending in the order I listed), and Chrome will let you filter to show only the level chosen. (On a Mac, hold cmd to select more than one.)
None of this is new, but what may not be obvious (and wasn’t, to me) is that each of the messaging methods has a couple helpful ways of formatting your output. The following examples use console.log(), but all of the methods in this group act in the same way.
Option 1) Pass strings or variables as individual arguments to a messaging method to avoid the effort of manual string concatenation. Doing this will also net you a more complete (or at least syntax-highlighted) representation of objects, arrays, numbers and regular expressions.
For example:
// Logging the content of an object, with a related message
var num = 5;

// Don't do this:
console.log('The value of num is ' + num + '!');

// Console output:
// The value of num is 5!

// Do this instead:
console.log('the value of obj is', num, '!')

// Console output (unchanged, but it was easier to get here):
// The value of num is 5!
Note that if you really wanted to inspect some variable in a log message, the next option provides much more flexibility:
Option 2) Use string substitution and formatting to easily create complicated messages.
For example:
var someVal = 5;
var someObj = {someProp: '12'};

console.log('appending value %s to %O', someVal, someObj);
results in:
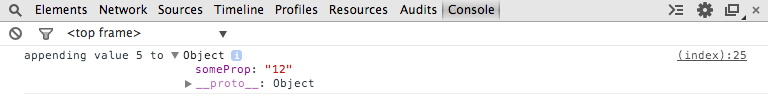
Here, %d and %O are ‘format specifiers’ representing references to a number and an object stored in someVal and someObj, respectively. I won’t go into depth on the different specifiers, but a quick tip is to always use %O for objects, arrays, functions and regular expressions to get a complete picture of what’s hidden inside them. If you’re interested, Google’s excellent resource on the topic lists all the format specifiers you can use.
Caveat warning:
Just like with console.dir(), log formatting has some unexpected behavior that you need to be aware of. More details at the end of this post.
Grouping: group, groupEnd, & groupCollapsed
The console’s grouping methods help keep all the stuff you’re writing to the console organized. group() and groupEnd() mark the start and end points for a collapsible ‘tree’ of log messages. Any messages that are logged between group() and groupEnd() will show up in the same branch of the tree.
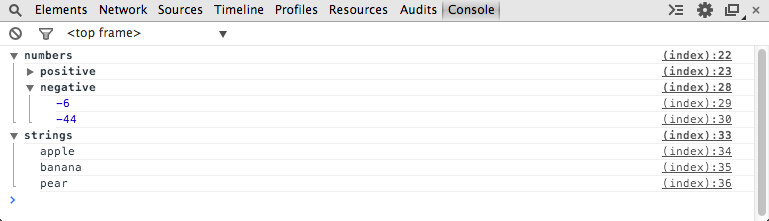
groupCollapsed() works the same way as group(), but its branch is initially collapsed, while group()’s is initially open.
group() optionally takes a label argument for your reference, and nested groups are possible. Just be aware that groupEnd() does not take a label–it simply closes the most-recently opened group.
Tables
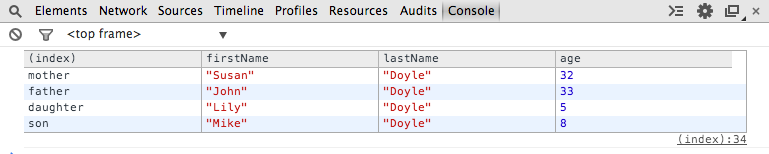
Tables are a flashy way to view and filter a subset of the data stored in arrays or objects. console.table() takes as its first argument an array containing the data (subarrays or objects) to be examined. Optionally, you can provide an array of key names as the second argument to display only those keys from each passed-in object.
Google’s example is solid, so I’ll reproduce it here:
function Person(firstName, lastName, age) {
  this.firstName = firstName;
  this.lastName = lastName;
  this.age = age;
}

var family = {};
family.mother = new Person("Susan", "Doyle", 32);
family.father = new Person("John", "Doyle", 33);
family.daughter = new Person("Lily", "Doyle", 5);
family.son = new Person("Mike", "Doyle", 8);

console.table(family, ["firstName", "lastName", "age"]);
results in the following list, which can be sorted by any of the columns:
Trace
console.trace() prints a stack trace from the time when it’s called. As usual, you get links to each respective line of source code to examine. If you want, you can pass a string to trace() to display a label.
Profile & ProfileEnd
You’ve probably used the Chrome JavaScript profiler to dig into performance issues in your code. The standard method of running a profile manually from within the Chrome dev tools is often sufficient, but if you want to inspect a very specific part of a program’s execution you can trigger the collection of a profile programmatically using console.profile() and console.profileEnd().
The label argument is technically optional here, but it’s best to provide one to avoid conflicts between multiple running profiles. Without labels, the general rule is that calling profileEnd() while more than one anonymous profile is running causes the most recent profile to end first.
Finished profiles are added to the profiles tab of dev tools.
Time & timeEnd
Sometimes you don’t want to engage the whole profiler to get a benchmark of your code. In those cases, it’s faster to use time() and timeEnd(). Call time(‘label’) immediately before the code you want to benchmark, and call timeEnd(‘label’) immediately after. TimeEnd() logs the elapsed time to the console.
Remember that the label on this one is not optional: you must call time() and timeEnd() with the same label or it won’t work.
console.time('testing settimeout');
setTimeout(function(){ console.timeEnd('testing settimeout'); }, 3000);

// Result:
// testing settimeout: 3000.613ms
Caveats:
I promised to show some strange behavior with console.dir() and console.log(), and here it is:
You’ve noticed that dir(), and log() (under some circumstances) will represent a value in the console in a drop-down ‘tree’ structure, like in the image shown in the dir() section of this post.
When displayed in this format, the value’s representation will change if the value it references is modified. The console representation of a value, when displayed in the dropdown format, is not a snapshot of the value’s data at the time it was logged. In fact, it remains live until you come along and expand the tree. At that point, anything inside is frozen from there onward.
This behavior extends to any place the console uses a dropdown representation, even if some data is already displayed, as shown in these examples:
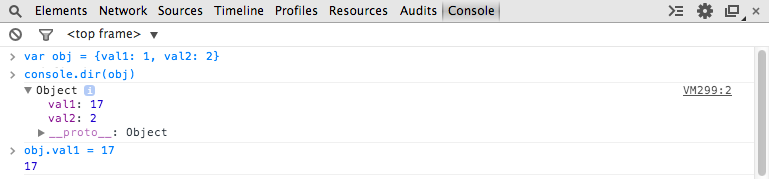
Here I console.dir() an object to to the screen, then before expanding the tree I change one of the object’s properties. Expanding the tree reflects val1’s new value, not the one it had when it was logged.
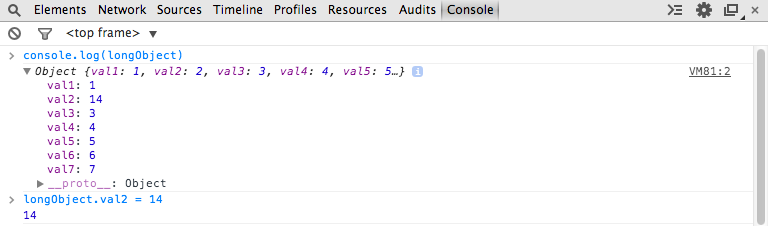
In this example, I use console.log() to show an object with many properties, then change one of the object’s properties before expanding the tree. Notice how val2 has a value of 2 on the first line, and a value of 14 on the third.
When in doubt, you should use a method that prints a string representation to avoid this problem. Try using JSON.stringify() for long objects or arrays to prevent a dropdown from forming.
By the way..
If you’re interested in seeing for yourself how the console represents various types of data in different situations, you can run the code in this gist